
A
Anonymous
Aug 18, 2021 6:19 PM UTC
Question: In Advanced Chart component of a Dashboard, can you show how to add a secondary axis?
- 0 replies
- 9 views
Answer
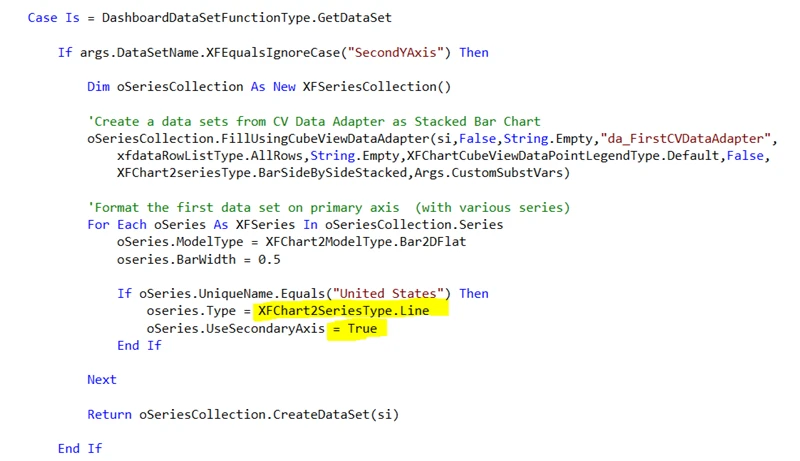
- If you are using the Advanced Chart component, a Dashboard Data Set Business rule must be used (example rule below)
- Ensure the following settings on the Advanced Chart component are correct:

Please note: This can be achieved in BI Viewer by adding a secondary Data Item and specifying then specifying in the options of that data item to plot it as a secondary axis. This is documented in the BI Viewer reference guide.
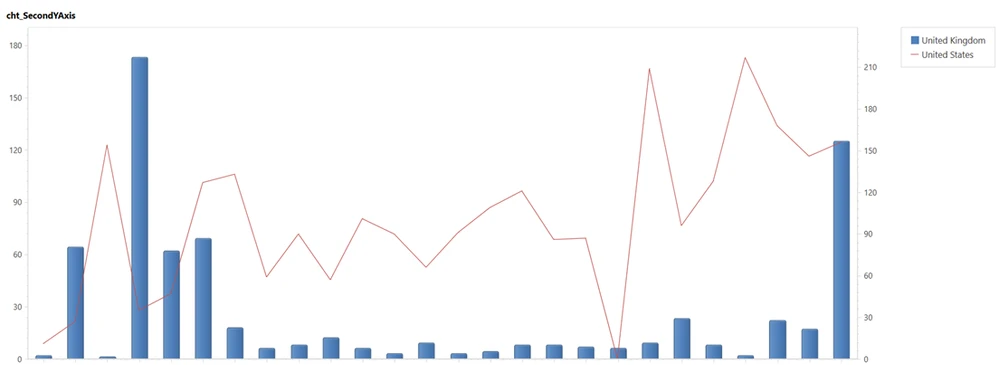
In this example, the United States series is changed to a line chart on the secondary axis:
Source: Office Hours 2020-03-26 Partner Enablement