OneStream Employee
November 11, 2021
Solved

Onion Graph on Dashboard

  • November 11, 2021
  • 4 replies
  • 0 views

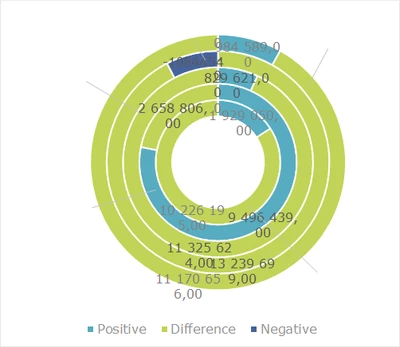
Jigsaw, one of the partners in South Africa needs to build an Onion Graph for one of our SA customers. Anyone have an idea how to do this?

rsmit_0-1636631857073.png


Best answer by ChristianW

I thought about it, but couldn't find it in the component, I assume, you have to build it in Excel, but it works in the spreadsheet?

Please mark you answer about as solution.

4 replies

OneStream Employee
November 15, 2021

We don't have an Onion as graph type in Onestream. If you're really desperate to do it, you might be able to use the Map Chart type. You can paint paint polygons on an empty map. You will need a lot of math to calculate all the points for the onion's circles.

I wouldn't do it, it is a lot of work and probably doesn't satisfy the customer anyway.

rsmitOneStream EmployeeAuthor
OneStream Employee
November 15, 2021

Thank you Christian. We've managed to build the Graph / Chart in a Spreadsheet component. It worked beautifully. 

OneStream Employee
November 15, 2021

I thought about it, but couldn't find it in the component, I assume, you have to build it in Excel, but it works in the spreadsheet?

Please mark you answer about as solution.

rsmitOneStream EmployeeAuthor
OneStream Employee
November 16, 2021

Hi Christian. Yes you are correct. Its not available in the component itself, it was built in Excel and then it works in the spreadsheet.