Solved
BI Viewer - Line chart Order by Time dimension
Hello,
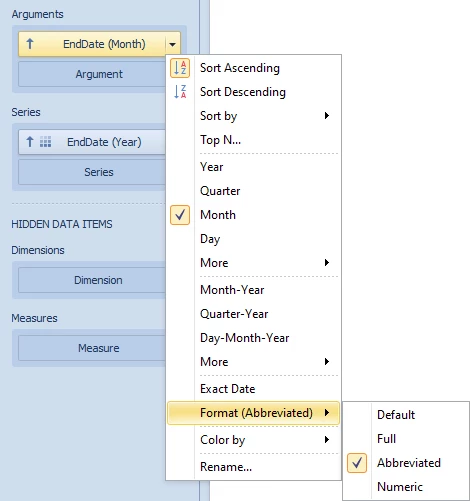
I am attempting to build a simple line chart through BI Viewer with Cashflow amounts in Y axis and Time (month-year) in X axis. I cannot get it to sort properly so it display data to flow through time. In the X axis, I choose Time for Arguments and sort in ascending. But it sorted as 2021M1, 2021M11, 2021M12, then 2021M2. When I change Time display from Name to Description, it goes by April-2021, April 2021 etc.
How do I set this up so Time dimension flow through chronologically?