Newcomer
March 31, 2022

BI Viewer - Expression to grab a specific account on pane

  • March 31, 2022
  • 1 reply
  • 0 views

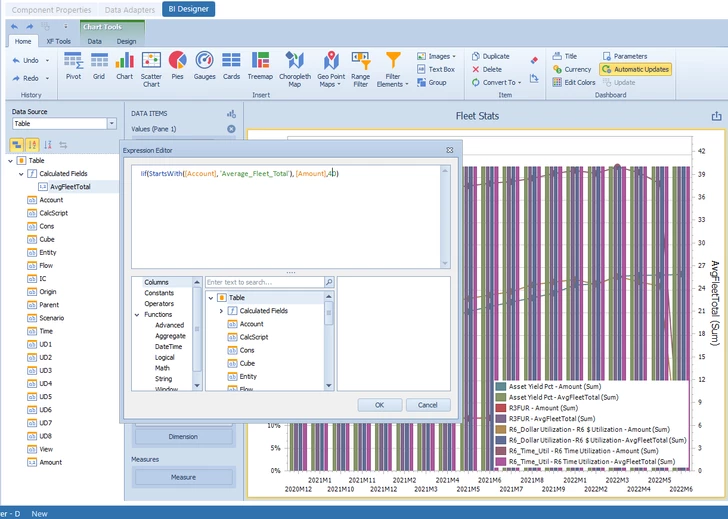
I'm trying to figure out how to build an expression that pulls "Avg Fleet" numbers and plot a bar chat on an existing pane. 

I've asked a similar question in this post - I was able to make the syntax work. However I still can not isolate just Avg Fleet. I would appreciate any suggestions on what I should fix. 

Mustafa_A_2-1648670244721.png


I've been fairly new to Dashboard building that I need help to my bearings. Co

1 reply

OneStream Employee
April 15, 2022

Hi, Mustafa.  I reviewed your previous post, and it appears that you got the column chart that you were asking about to work.  I am not clear exactly what you mean in this current post.  Are you wanting to overlay a (horizontal) bar chart over the column chart above (on the same pane)?  I am fairly certain that that is not possible.  If that is not your request, can you please elaborate further?  Thanks.

Newcomer
April 17, 2022

Yes! That's exactly what I'm hoping to achieve. Basically overlay a bar chart (representing Total Fleet) over a line chart (representing Asset Yield for example)

The reason I believe its possible is because BI allows to draw a "second plot" which made me wondering if you can have two different types of data (Percentage and Dollar Values) on the same pane. 

OneStream Employee
April 19, 2022

Hi Mustafa.  I did a bit of experimentation.  You can, as you know and have demonstrated, put a bar chart on one axis and a line chart on a secondary axis.  But I believe that what you wanted to do was to have a bar chart and line chart within the same pane and on the same axis.  In my experimentation I put a bar chart and 2 line charts on the same axis, as shown in the screenshot below.  One line chart uses the same data value as the bar chart but the other uses a different data value.  This was done using only one data source (data adapter).  My understanding is that it is only possible to have data from a single source within a chart.  I'll also paste below a second screenshot showing the Data Source and the Data items panes.  I hope this helps.

BNuck1_0-1650327440460.png

BNuck1_1-1650327881886.png