BIViewer range filter component
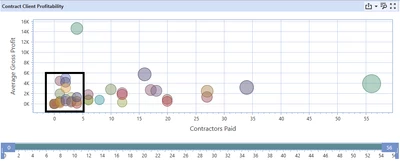
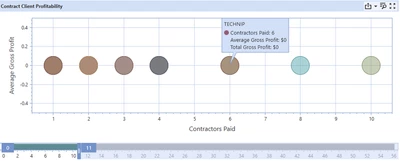
We're looking to use the scatter graph component in BIViewer to display client profitability by 2 metrics, average pricing & volume. This has worked perfectly, however when adding in a range filter component to allow users to filter down on the volume, the graph returns 0 values for metrics other than the volume.
Initial state
Filtered state - volume between 0 & 11
Is there something we're missing when using this component?
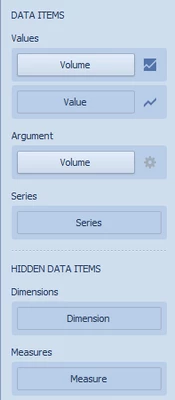
Range filter data items